 866.249.6095
Google Analytics is a free website analytics tool first released in 2005. Today nearly every website utilizes this service or the premium 360 version to make informed decisions about developing their websites and more importantly to Google, how to spend their digital ad dollars. Google has, over the years, greatly expanded and improved Google Analytics providing a treasure trove of data and stats about how users interact with a website.
With all this information provided from having Google Analytics installed, diving into the data can be a daunting task.
What stats matter in Google Analytics?
And specifically to this article, what Google Analytics data matters to vacation rental websites and resorts? (what data matters can vary greatly depending on your product and/or website intent)
I’d like to lay out a short list from my perspective as a daily user of Google Analytics focused on marketing for vacation rental companies and resorts. My first experience with Google Analytics was nearly 10 years ago, and I distinctly remember my boss at the time saying “ready to go down the rabbit hole?” Well I did and haven’t come up since.
Let’s get into it, and see if I can lay out some helpful points for anyone looking to discern useful information from Google Analytics.
Google Analytics Stats That Matter (Down The Rabbit hole)

Make Sure Google Analytics Is Set Up Correctly
It’s always the first thing I do. There’s all kinds of issues that can cause data not to flow through Google’s Java Script onto the platform. You can’t make sense of any of this data if it’s missing or misleading.
Most of this can be discovered quite easily and here’s a tool to do it if you use Google Chrome: https://chrome.google.com/webstore/detail/tag-assistant-by-google/kejbdjndbnbjgmefkgdddjlbokphdefk
Now there’s not just one way to install Google Analytics, and either installing the legacy universal Google Analytics code, or updating to utilize Google Tag Manager to install Google Analytics is possible. Lets not get into the weeds of this here, but note if you’re not seeing smiley faces using that Google Tag assistant tool, something may be awry.
Here are some other ways you might tell if something is not set up correctly:
- Bounce Rates are extremely Low (Anything under 20% I’d be skeptical of)
- E-commerce data isn’t even nearly accurate
- Tracking of certain campaigning isn’t showing up
Just three here, but they’re important.

If your bounce rates are low I’d guess you’ve installed Google Analytics twice on the site.
If your E-commerce data isn’t flowing or inaccurate get with a programmer to pass the right info. It’s helpful to have this information flowing as best as possible. It’ll likely experience some issues even when optimally implemented, but when it’s close it becomes very useful in making marketing decisions.
If your campaigning for something like email isn’t coming through this typically isn’t a Google Analytics issue, but rather not properly utilizing the Urchin Tracking Method (UTM). Make sure your advertising and direct marketing campaigns have some sort of tracking Google Analytics can read. UTM tracking is useful for things like email marketing, tagging Google My Business traffic, and more.
Source/Medium: A Basic Staring Point
Now that we’re sure we’ve got data flowing where should we go first? How should we look at it?
Google Analytics homepage is full of neat info from a 30 day trend, current active users, all the way down to algorithms giving you insights on what you should focus on. Wow, already too much.
Let’s just conceive of a baseline view based on our website and what it’s all about. For vacation rental companies that’s typically focused on year over year comparisons, since no two months ever really compare to each other, as well what different channels are performing and how.
That’s why I like to begin at Acquisition – followed by All Traffic – and Source/Medium
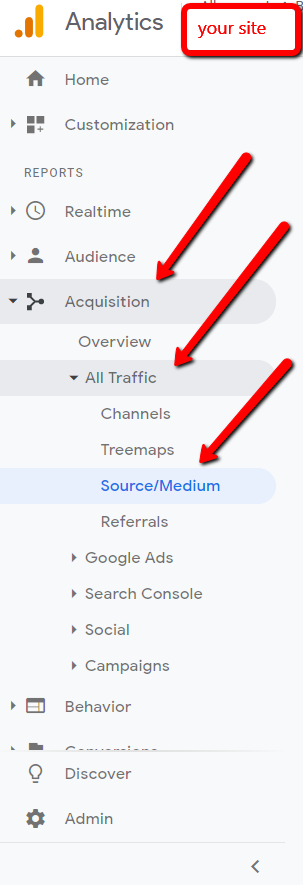
Pick some dates to compare and head there. Using this view you’ll get a look at the break down of the different sources for your website traffic. The Channel view is good too, but that will lump in Bing organic traffic to Google organic traffic, and I just don’t think that’s fair. You’ll also see the most frequented ways people interact with your website be it referral traffic, social media, organic, or paid, and exactly how.
In these columns you’ll get a feel for how these sources of traffic compare in terms of how the audience spends time on the site. You’ll likely see a large difference in time spent between these different sources, and that’s not always bad.
With E-commerce tracking you’ll see how often each source converts to dollars as well. We won’t go into Google Analytics Attribution methods, but note this is also important in determining any ROI on paid spend or any other source of traffic. (learn more about attribution models on Google https://support.google.com/analytics/answer/1662518?hl=en)
From Acquisition to Behavior (Bounce Rate, pages per session, Duration On Site)

From this basic starting point within Google Analytics lets review the different behavior metrics that are displayed and matter to sites like vacation rental company websites, and resort websites.
Bounce Rate
This metric simply determines how often a visitor visits a page on your website and then leaves without visiting another. If this rate is 50% or above on any source/medium there’s probably something you can do to correct that. Some sources of traffic are going to be harder to change than others. Facebook traffic is notorious for having a more dismal bounce rate, but that’s just the audience. They’re just not likely to be as engaged.
If your Paid traffic labeled CPC in either Google or Bing is above 50% consider that you may be targeting your intended audience poorly. Seek expert advice as every stray ad served is just investment lost.
Pages/Session
This is just the average number of pages visited during one user’s session all averaged up. It can vary from site to site, but you’ll want these numbers to match up between different sources of traffic. Take your best source and try to influence the other sources to match up to it.
Avg. Session Duration
Longer time on site typically is a positive thing. Anything under a minute is probably in need of help.
All of these behavior traits will in all likelihood be similarly good or bad, based on what that bar is. Often these data points are overlooked and shouldn’t be. If you want to know what to attack to improve your website, using these metrics is a great place to start.
Audience — Mobile First Matters

Today’s websites have to be mobile friendly. You’ve no doubt heard about mobile first design, indexing (by Google), responsive design, mobile friendly websites, and on and on.
The truth is that isn’t that old of a phenomena. Most likely we’re all guilty of not focusing enough on the mobile experience, but
in 2019 it’s a must.
I’ll wager you a bet that when you look at your mobile traffic for 2019 it’s more than 50% of all website traffic period.
Go have a look by first selecting Audience –> Mobile
Another reason to point this out is because if you’re going to improve on the source/medium areas of traffic that are hurting you need to figure out why they are. It may be down to the device the users are visiting your website on.
Similarly, view the different metric points discussed above and see if mobile is standing out as a poor performer.
Don’t get too dismayed if mobile has a higher bounce rate and shorter spans of time spent on the site. This is normal as typical social media traffic will be heavily visited solely on mobile, and users are typically in situations where they have less time to engage with content.
This kind of idea will flow all the way to converting on mobile, but that doesn’t mean it should be poor numbers. Good mobile experiences can move the needle for the entire website. It’s also increasingly your first impression, and man do you need to make a good first impression if you’re going to convert.
What Pages To Work On? Google Analytics Behavior Tab
Lastly, for this article I’d like to show you another must visit area within Google Analytics.
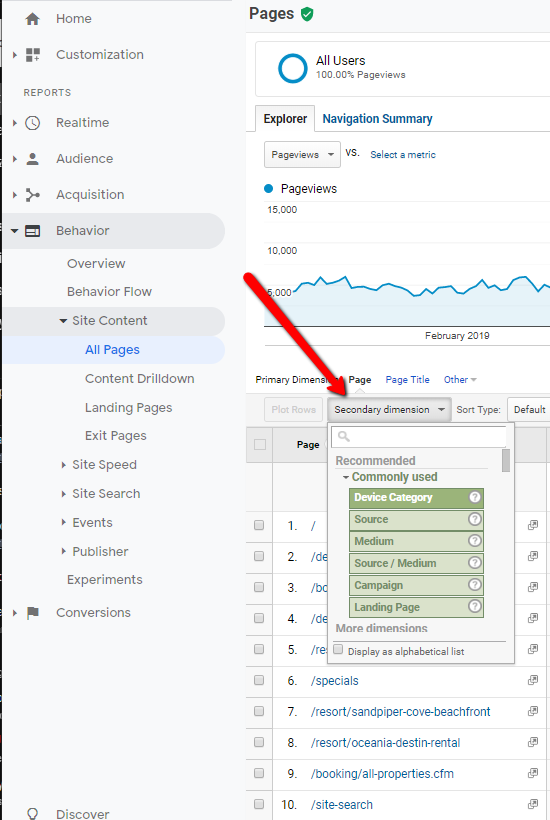
Head over to: Behavior –> Site Content –> All pages
Now that we know what to evaluate, bounce rates and other behaviors, let’s find out if any particular pages are especially responsible for poor user experience. In these top 10 pages you’ll want to see flat out great numbers.
We’re talking about 20% to 40% bounce rates and no higher. Also low exit rates for these top 10 pages because typically these pages will be the first pages visited by all users of your website.
If any pages aren’t looking good, go see them for yourself and divide up the stats using a secondary dimension in Google Analytics by device.
View by device secondary dimension:
Landing Pages
Also, under this Behavior tab you can view your landing pages. They’ll be similar to your most visited pages, and all “landing pages” means is that these pages are the first pages visited on your website.
The difference is Google Analytics will credit these pages with transactions rather than page value like the previous “All Pages” section.
Look for sore spots using the knowledge of bounce rates, pages visited, and time on site to determine if there’s any standouts.
Hopefully this guide serves to help get you interested in analyzing your Google Analytics. Make sure it’s properly implemented and then go look for some of these stats. I promise if you do, you’ll be able to figure out where any points of contention are for users, and begin to improve your website.
It’d be great to get your feedback if you’ve made it this far. Put in a question or comment below and let’s strike up a conversion.